

USD/CAD is drawing a declining trend on the daily chart, and the pair hits triple support around 1.38 in 6-weeks from the first hit in April 2020. The major resistance on the daily chart lies at 1.467, and the pair has been lacking momentum over the past two months now and currently trades at 1.399.
Here, the US Dollar is seen weakening against the oil-linked Canadian Dollar. The intraday pull back from 1.40 price area has served to be the lower high after 1.467 seen on March 31, 2020.
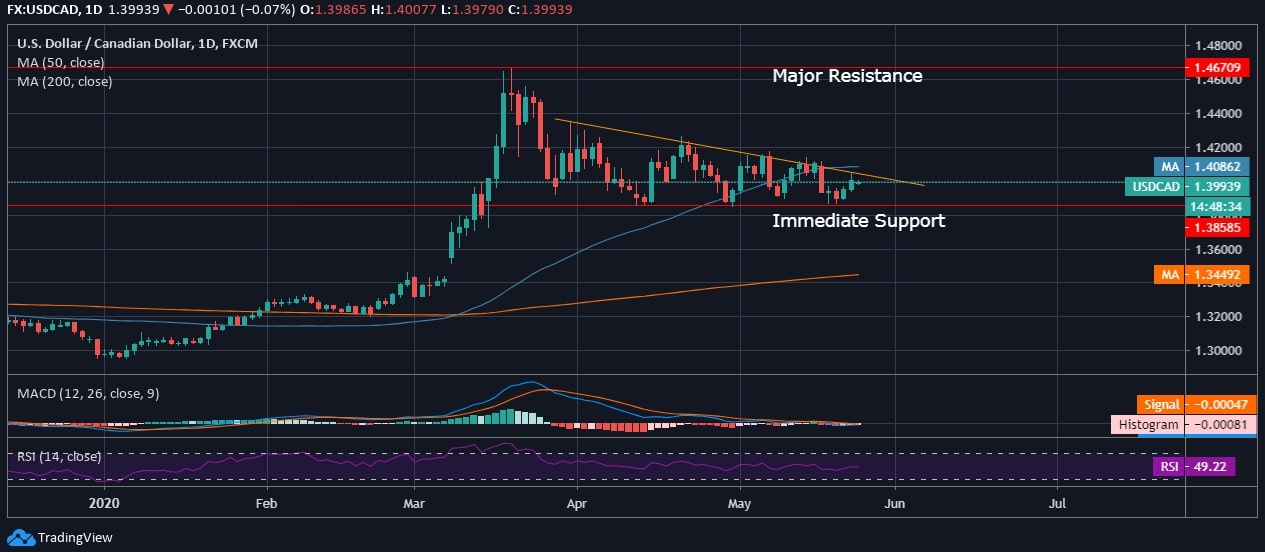
On the daily chart, USD/CAD holds major and immediate support at 1.385 to 1.380, and a further dip below the stated price level is likely to draw a daily bearish divergence. The current lack of momentum has led to a lack of support from 50-day daily MA while retains a 200-day MA at 1.344. However, if USD/CAD fails to regain the momentum quickly, it is likely to retest 200-day MA support on the daily chart.
Moreover, it was in the opening hours on Monday, i.e., May 25, 2020, the pair was trading around 1.400 but lacked steadiness to hit 1.405 and dipped otherwise. While 50-day MA remains unattended at 1.408, this marks the major resistance to watch out for at 1.405, followed by 1.408, and the immediate support lies at 1.385.
The technicals are drawing a complex picture as the MACD holds a bearish crossover on the daily chart and also appears flat, while the RSI lies at 49.22 and shows no trading extremities.


