

GBP/USD exhibits a double top in the intraday below 1.224 yet fails to regain support from the nearest MA, i.e., the 50-day daily MA at 1.223 on the half-hourly chart. The weekly movement of Pound against the US Dollar is drawing a notable downtrend as it falls from the weekly high of 1.246 to a weekly low at 1.218 in the trading hours, today.
The intraday resistance lies slightly above the double top at 1.2241, and the US Dollar is seen benefitting in the intraday as Pound weakens against the greenback. On the flip side, the support lies at 1.218 on the intraday chart as the pair recorded a 7-day low today since May 7, 2020.
GBP/USD Analysis:
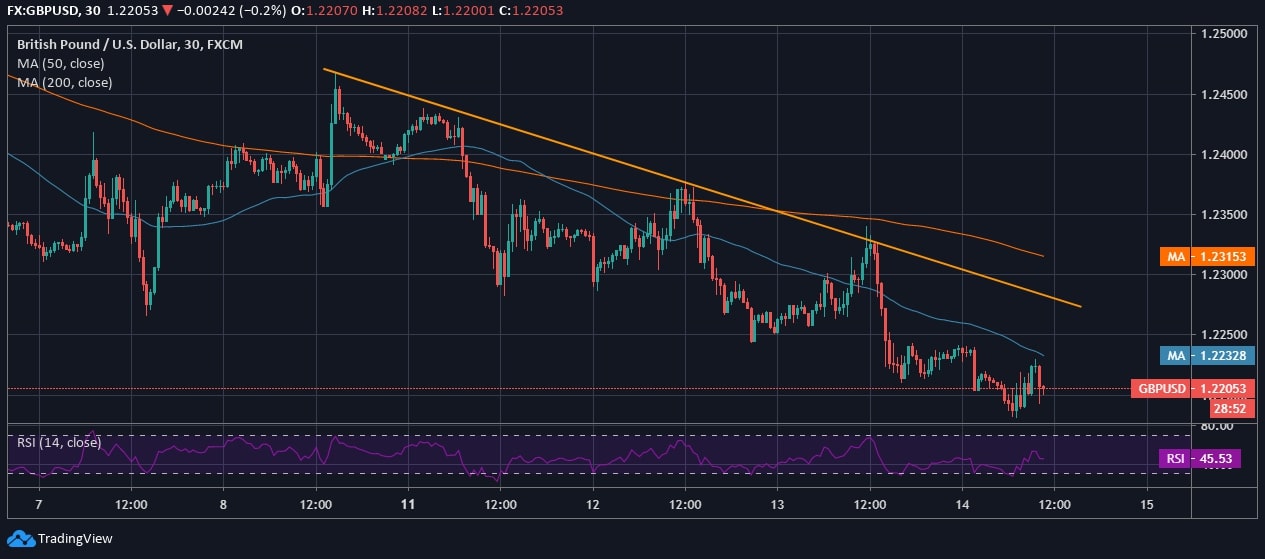
On the half-hourly chart, GBP/USD had given up the gains that were fetched over the past 7 days when the pair spurred at 1.246. After a gradual fall over the past four days, Pound has hit the lower price of the range today. And, after the 2nd consecutive lower high, the pair lost steady support from 200-day MA on the half-hourly chart as the price declined from 1.235.
Undoubtedly, Pound recovered in the intraday, and at the time of penning down, it was trading above 1.22 against the US Dollar. As per the given intraday movement of GBP/USD, the RSI of the pair grew from the utter selling pressure and currently lies at 45.53, and the intraday appears moderately volatile.


