

- The Ethereum price correction could seek bullish support at the $4,000 level, which coincides with the 23.65% Fibonacci retracement level and a recently breached triangle pattern.
- During today’s price dip, two whales bought ETH worth $115.01 million from liquidity provider FalconX.
- On-chain data highlights Ethereum’s supply shift from weak retail hands to strong high-network investors, bolstering a potential for sustained recovery ahead.
Ethereum, the second-largest cryptocurrency, plunged over 2.6% during Monday’s U.S. market hours to trade at $4,348. The sell-side pressure aligns with the broader market pullback amid the macroeconomic developments in the United States. Despite the price pullback, the high-net-worth investors are continuously accumulating more ETH, indicating a firm buy-the-dip sentiment. The technical chart further accentuates a healthy pullback in price to regain exhausted bullish momentum for the next leap.
Ethereum Supply Moves from Retail to Whales
In the last five days, the Ethereum price has shown a brief pullback from $4,791 to its current trading value of $4,338, registering a 9.4% loss. The correction was triggered by the recently released U.S. July PPI data, which projects inflationary pressure on the country and reduces the possibility of an interest rate cut in September.
However, the daily candle shows a long tail rejecting today’s price movement, suggesting an increasing buying pressure from the bottom. According to the on-chain intelligence platform Arkham, two new whale addresses have scooped up a combined $115.01 million worth of Ethereum from liquidity provider FalconX.
Despite the price pullback, this surge in whale buying adds to a buy-the-dip narrative in the market.
A recent tweet from X user IT_Tech shares a sharp divergence in investor behavior where retail wallets are exiting their ETH holdings and whales are aggressively accumulating. As shown in the chart below, the retail wallets have dropped to 8.5 million ETH, their lowest value in several years.
Meanwhile, the whales show a parabolic surge to 19.1 million ETH, setting a new all-time high. The contrast highlights how the ETH supply is shifting from retail, often called “weak hands,” to the large holders, known as “smart money,” with holding capacity.
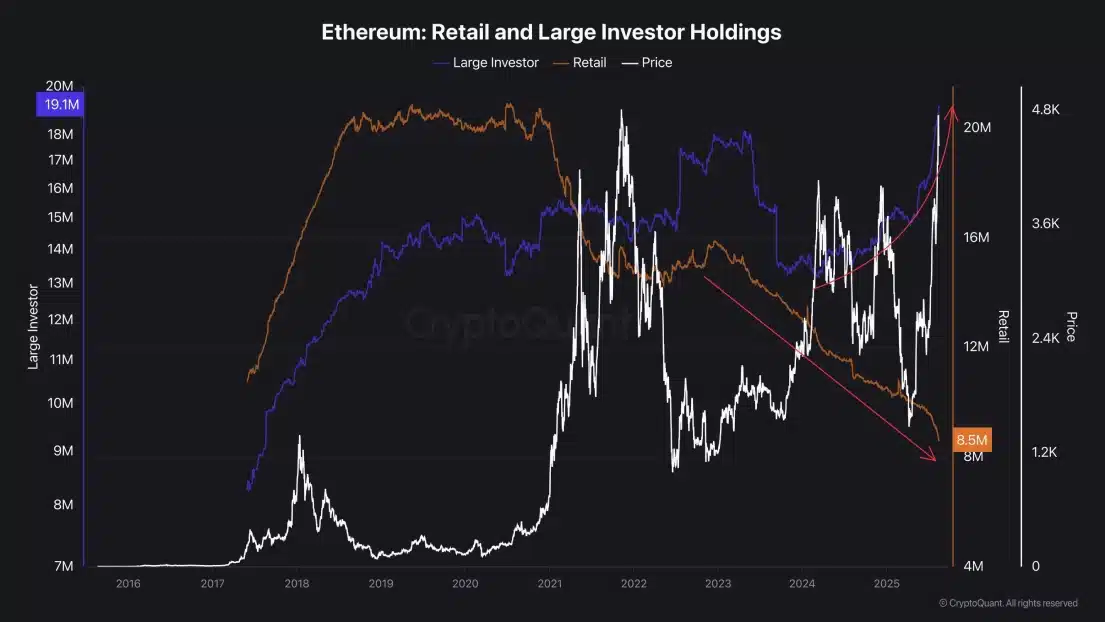
Interestingly, the analyst mentions that the Ethereum price has yet to fully reflect this supply redistribution.
Historically, this ownership shift has supported a significant shift in coin price.
Also Read: Why Did Bitcoin Price Fall Today? and What’s Next
Key Support For Ethereum Price in Current Correction
The daily chart analysis of Ethereum shows its price has reversed just inches away from the ATH of $4,878.26. As the falling price likely follows broader market sentiment, the intact demand pressure from whales should bolster ETH to seek suitable support.
Amid the ongoing recovery, the Ethereum price projected two bearish pullbacks within the range of 23.6% and 50% Fibonacci retracement levels to restore bullish momentum. The momentum indicator ADX (Average Directional Trend) at 46% hints at the overexhausted push from buyers and the need for a short pullback.
If the market selling pressure persists, the price could plunge over 9.7% to retest the $4,000 level. This psychological level, coinciding with the recently breached triangle pattern and 23.6% FIB level, creates a potential foothold for buyers to counter bearish momentum.
Over the past 45 months, the coin price resonated with activity within the triangle’s converging trendline to drive a long-accumulation trend. On August 9th, the coin price gave a decisive breakout from the pattern’s resistance trendline as a signal for continued recovery.
If the support holds, the price could rally towards $4,868, followed by $5,861.
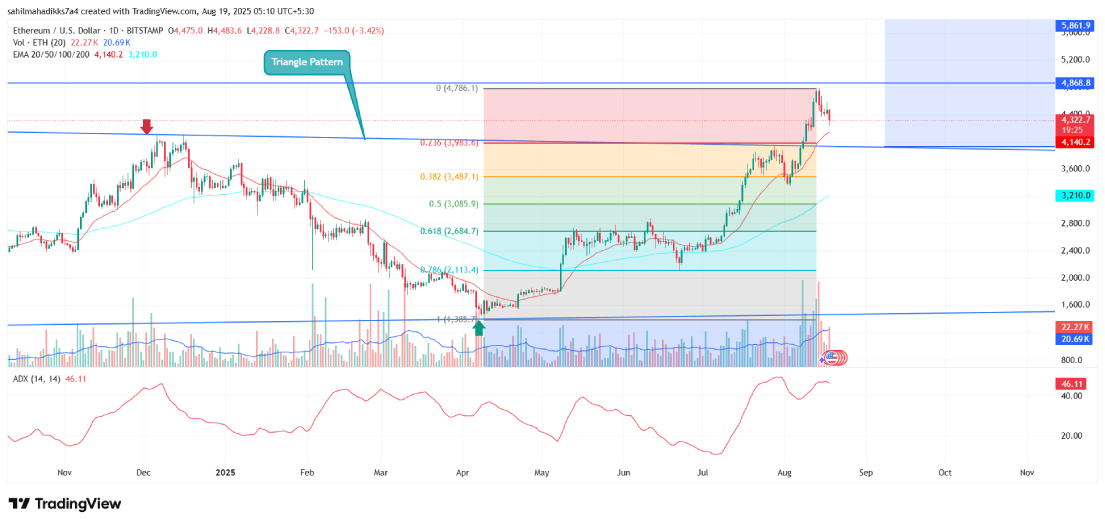
On the contrary, if the $4,000 support breaks, the buyers could seek support at $3,500 and $3,087, which move closely with the 8.2% and 50% retracement levels, respectively.
Sahil Mahadik
As a full-time trader with over three years of hands-on experience in the financial markets, I have honed an exceptional proficiency in technical analysis, which is the cornerstone of my daily monitoring of price fluctuations in leading assets and indices. My journey into trading began with a deep fascination for financial instruments, and this curiosity naturally expanded into the ever-evolving world of cryptocurrencies. I am currently contributing to CryptoNewsZ and have also written for Coingape, The Coin Republic and TheMarketPeriodical. I am driven by my passion for the markets and want to explore new opportunities, I analyze emerging trends and strategies to get maximum returns in traditional and crypto markets.-
Notice: Trying to access array offset on value of type bool in /home/bostoncaracciden/forexnewslive.co/wp-content/plugins/wpsmart_siren/widgets/featured_post_by.php on line 275
Notice: Trying to get property 'term_id' of non-object in /home/bostoncaracciden/forexnewslive.co/wp-content/plugins/wpsmart_siren/widgets/featured_post_by.php on line 275


